Say hello to our new statistic tools 🚀 | Summer 2022.
Aug 25, 2022 • 5 min read • Download article ![]()

.
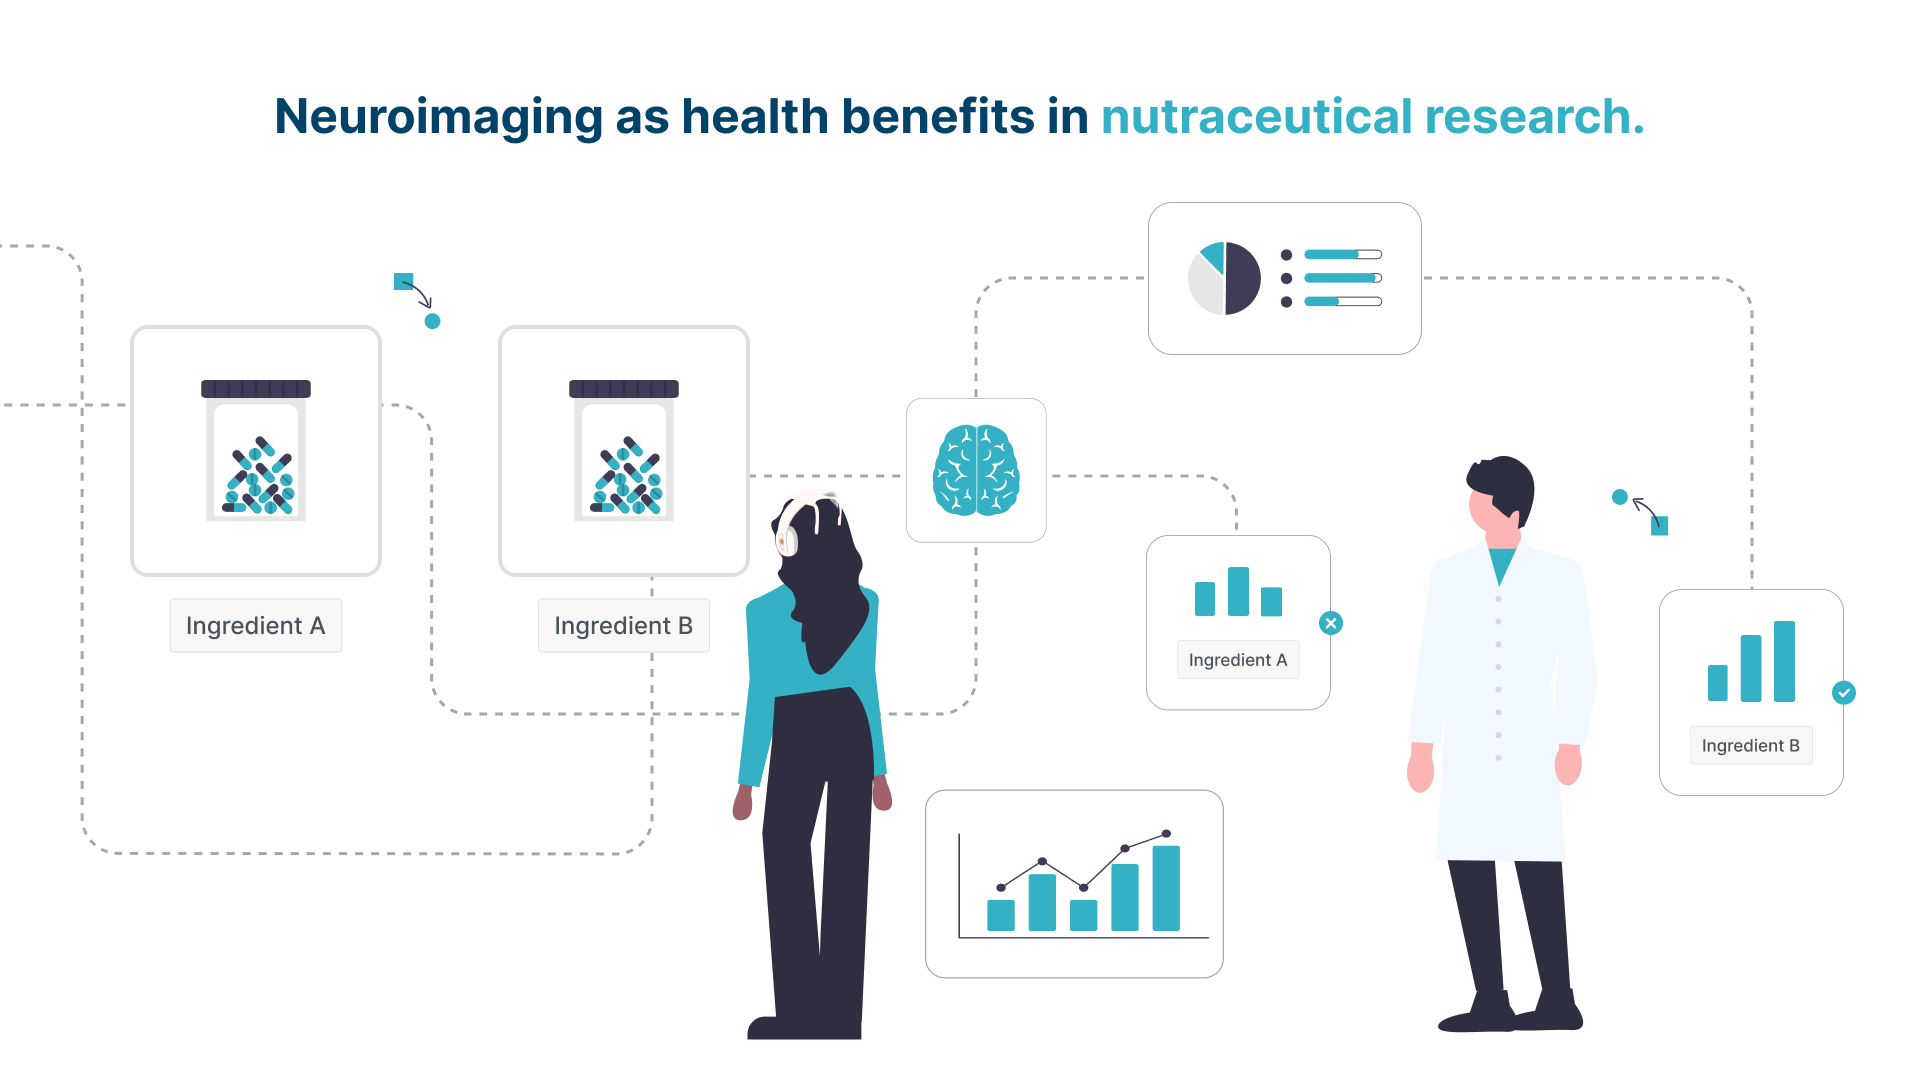
Statistics are here! ✨
Discover now our new statistic tools in Analytics to easily interpret your protocol results.
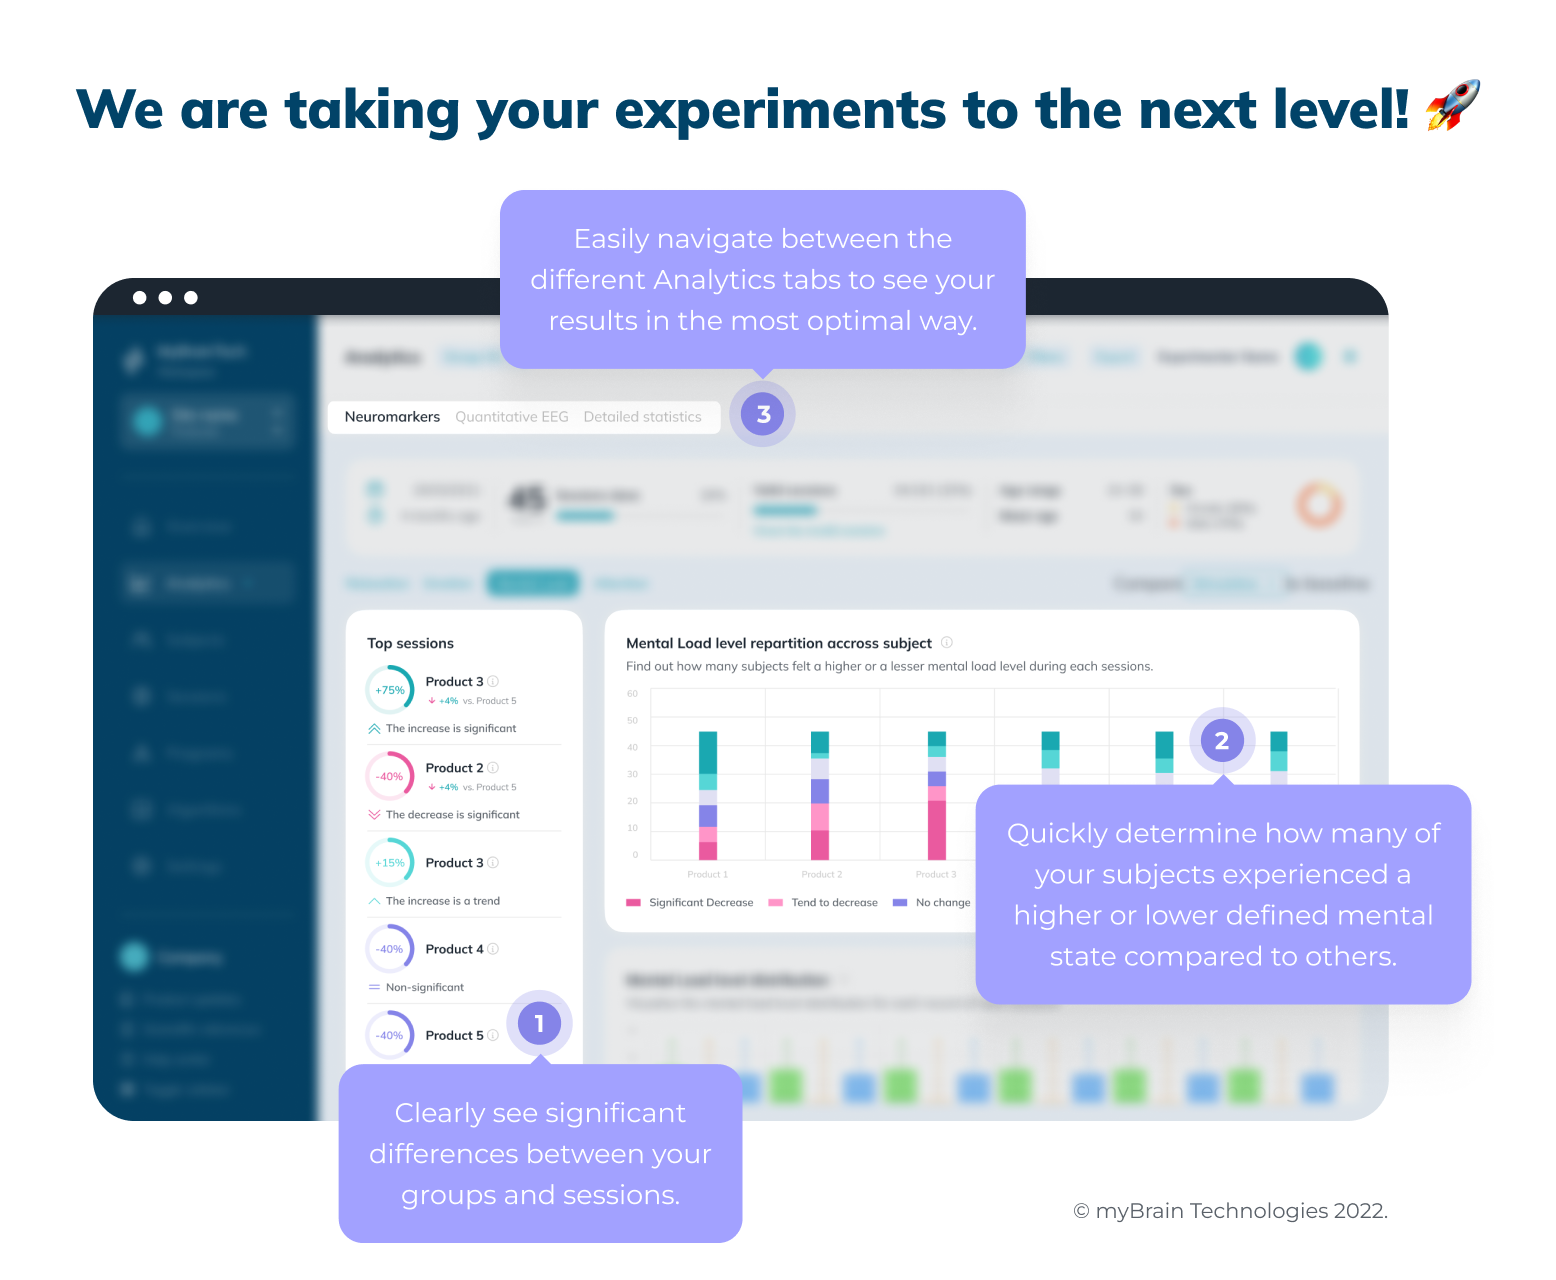
Easily navigate, clearly see and quickly determine the effects of your products on your subjects to optimize your decision making.
We explain the new features right below👇
Summary |
Top Session Statistics 🥇 |
Individual Statistics 🧠 |
Different Analytics Tabs 📊 |

 Top Session Statistics.
In the Neuromarker tab, the Top Session section allows you to directly estimate significant differences between your groups and sessions.
If you need more complete information, you can use the Detailed Statistics tab to access in-depth tables.
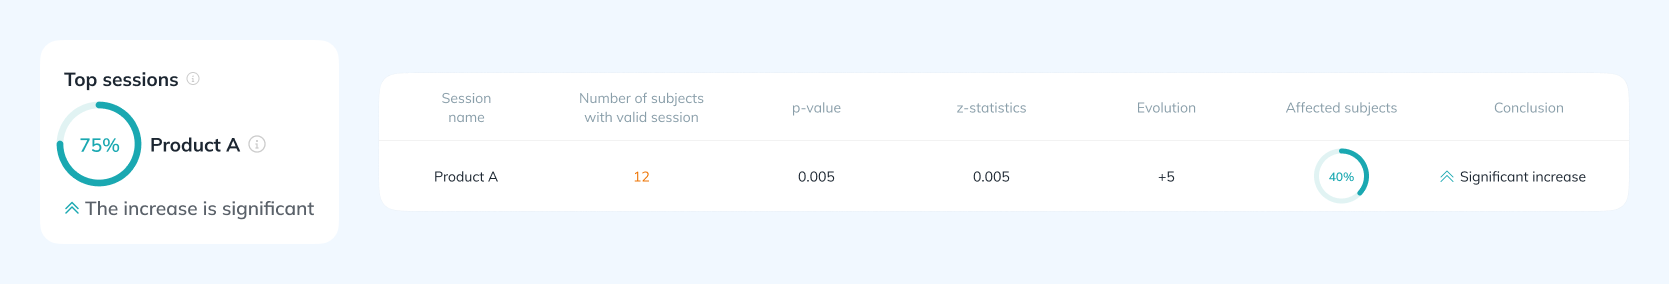
Evaluate the effects of your products.
Now, for each product, assess whether there is an increase or decrease in a given mental state within a group of users, thanks to these items:
✔ The column Evolution percentage gives the difference of the Neuromarker level between the stimulation or resting state and the baseline.
✔ The column Subjects impacted gives the proportion of subjects who experienced the observed effect.
✔ The column Conclusion helps you interpret the result of the statistical test.
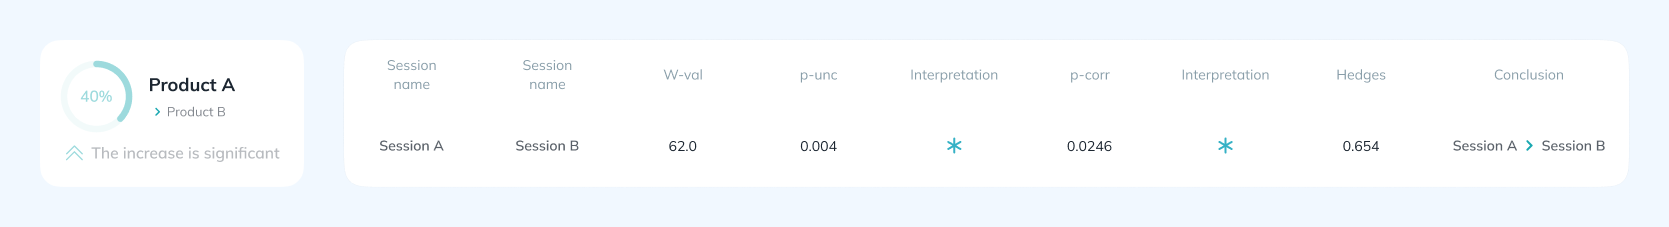
Compare the effects of your products.
By comparing the sessions to each other, evaluate the significant differences in the effects of your products.
This way you can determine if your Product A is more effective than your Product B for a given mental state, for example.


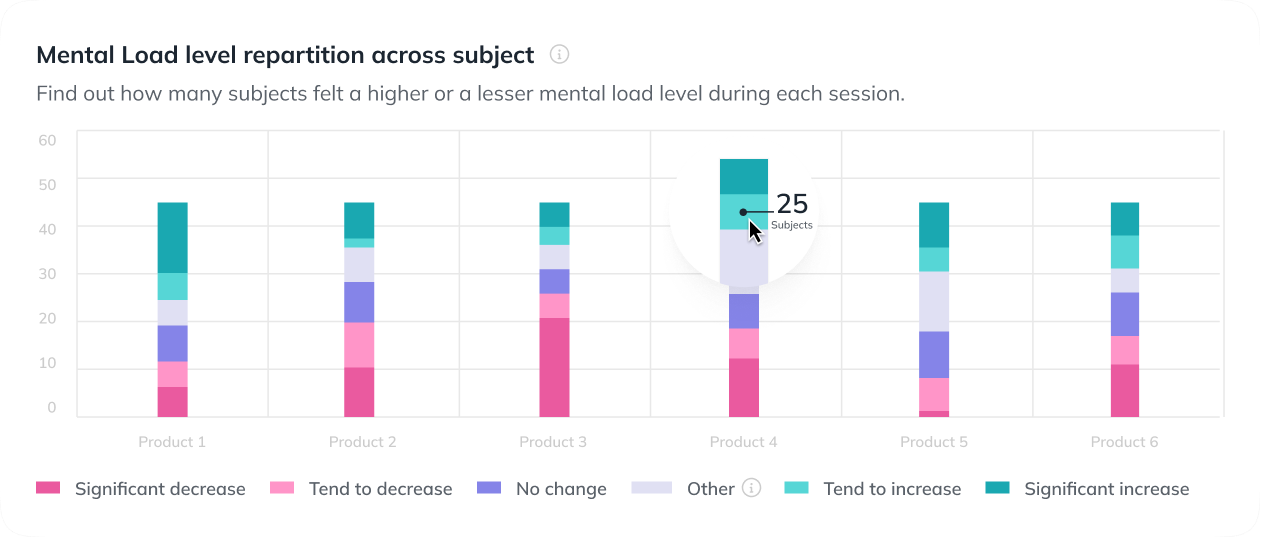
 Individual Statistics.
In the Neuromarker tab, the first graph let you know the Neuromarker change across users for any of your products.
Just hover each color on the graph to find out how many subjects experienced an increase, decrease or no change in their mental states.

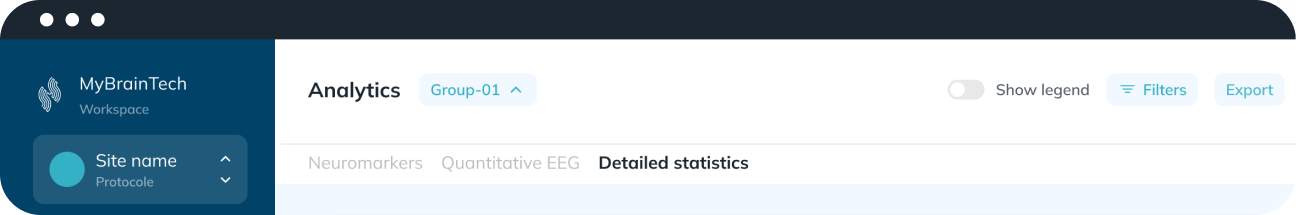
 The different Analytics Tabs.
We have improved the ergonomics of our Analytics section to make it easier to navigate between the different Analytics tabs.
Neuromarkers Tab.
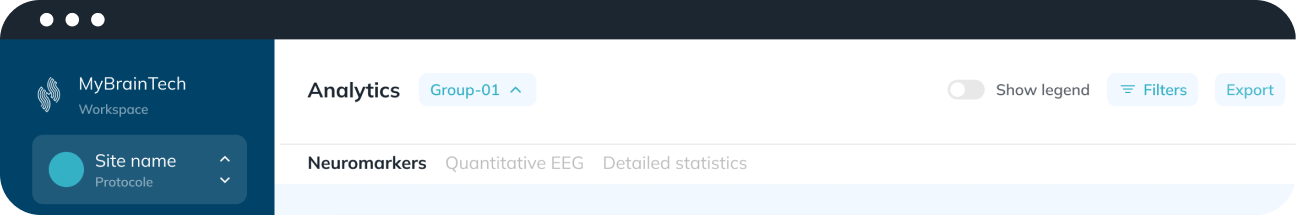
Here, you can access the results of each Neuromarker as a graph with different types of visualization.
As previously seen, the Top Session section, on the left, provides you a synthetic view of the most significant results.
Also, the ability to switch between the different Neuromarkers and compare each recording, gives you an overview of your experiments.
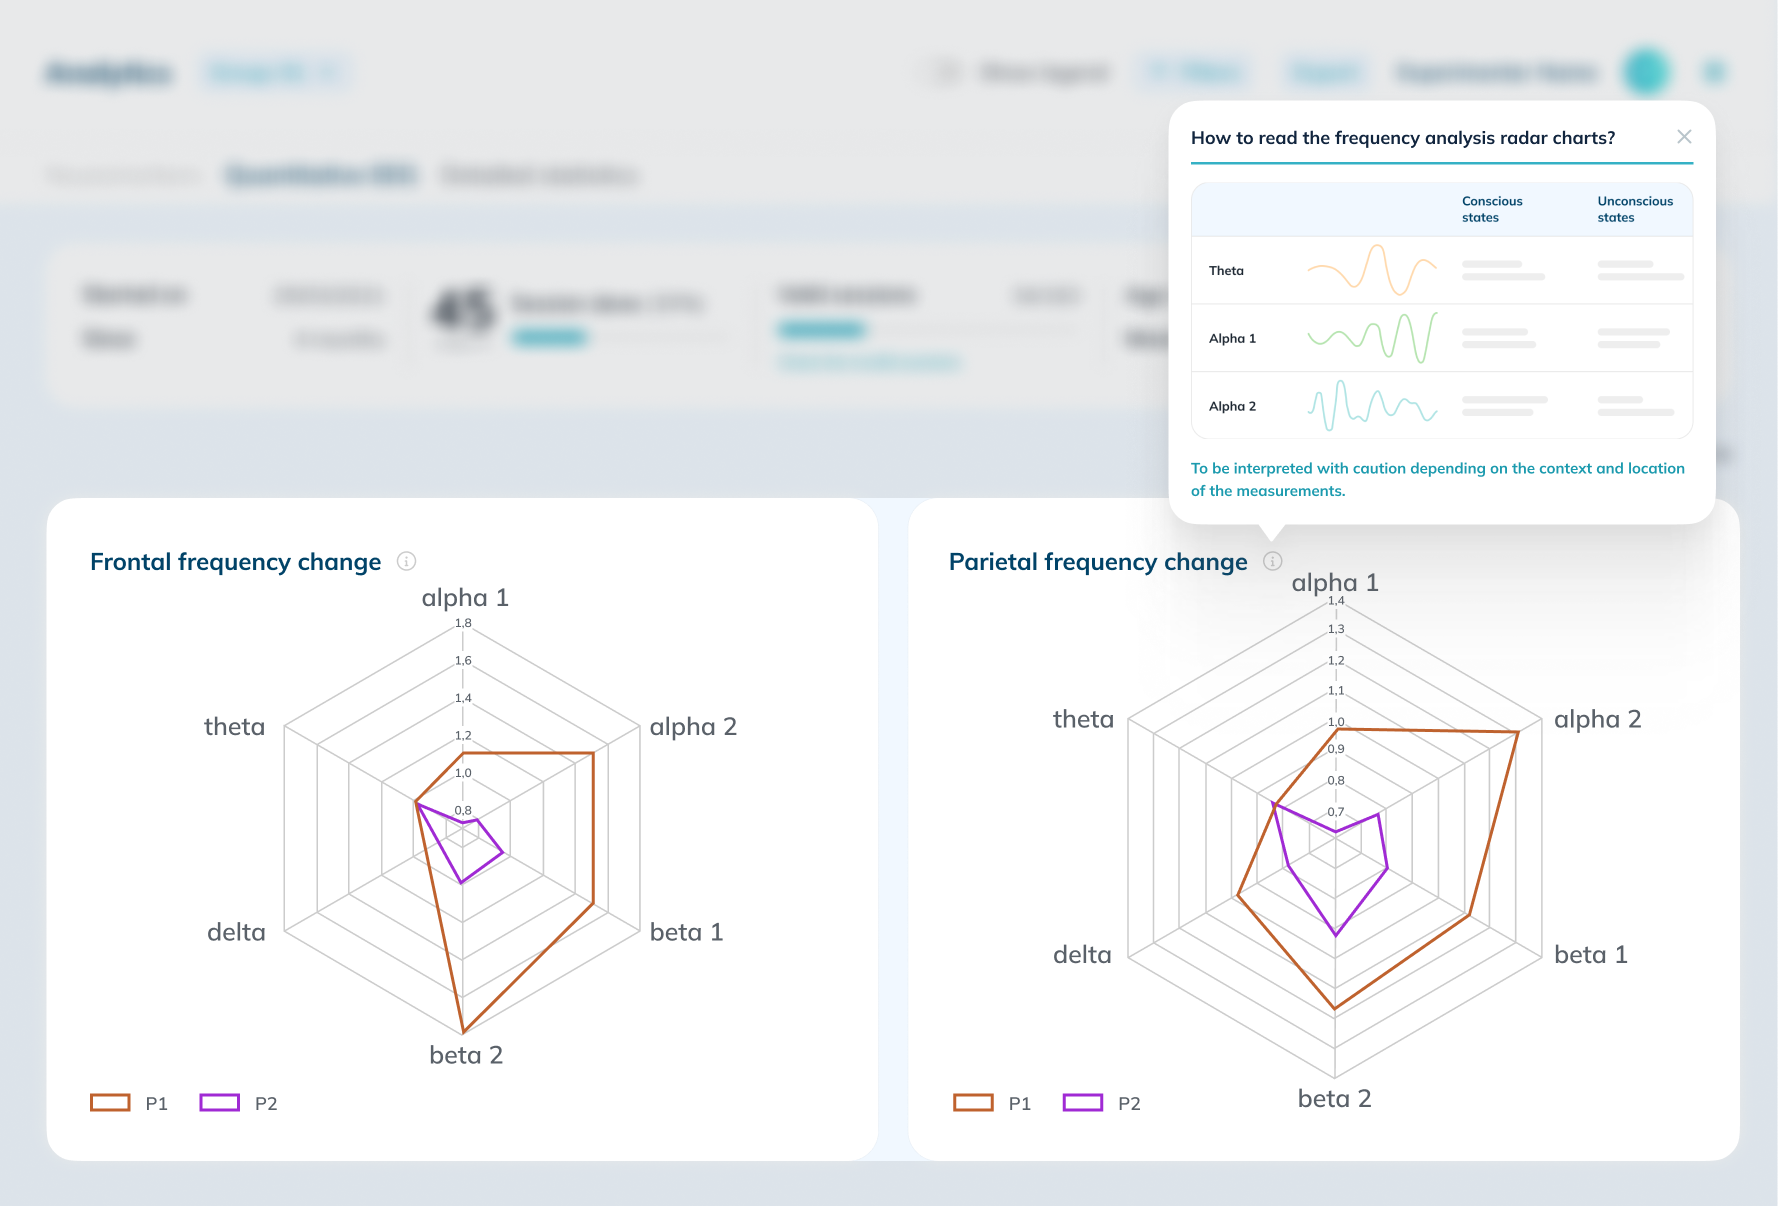
Quantitative EEG Tab.
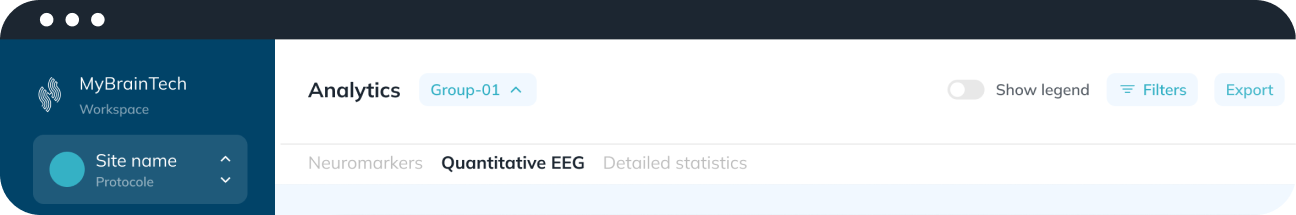
It’ s available again in the Analytics!
You can visualize the ratio between the stimulation or resting state and the baseline for each sessions for each frequency band and compare them!
An information pop-up is there to help you easily interpret these results. Understanding which frequency band is related to which mental state becomes a breeze.
Detailed Statistics Tab.
If you need detailed informations for your external reports, or for writing your scientific papers, here what you will find in this section:
✔ The details of the statistics calculated with the p values.
✔ The tests performed.
✔ The summary tables of the results for each session and each session comparison.
© 2022 myBrain Technologies, All rights reserved.
50 Avenue Claude Vellefaux
75010 Paris